The Iranian People Are Getting Poorer
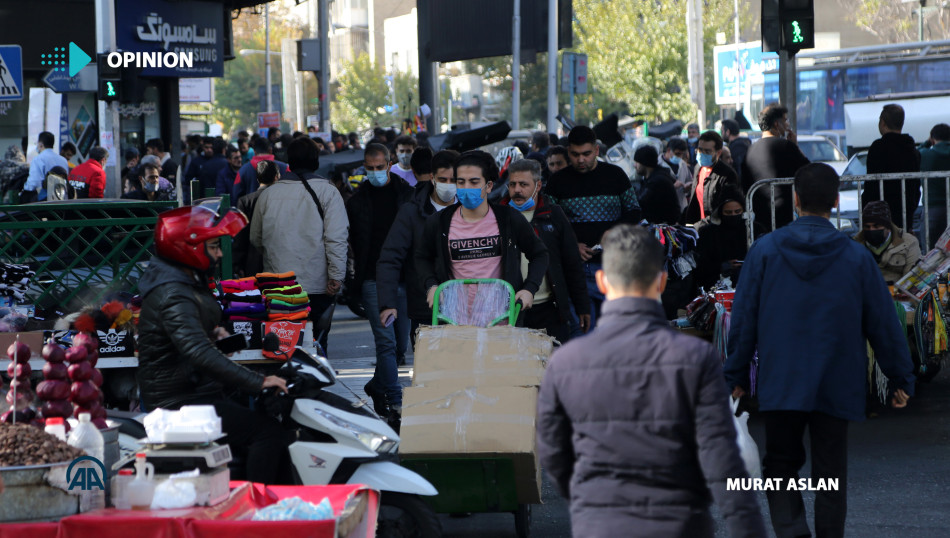
The unilateral withdrawal of the United States from the Nuclear Deal, also known as the Joint Comprehensive Plan of Action (JCPOA), in 2018 and then the re-imposition of, previously imposed, US sanctions against Iran has affected several economic, political, and social indicators. The re-imposition of US sanctions and also the adverse effects of lockdown (and other) measures due to the COVID-19 pandemic, have deeply influenced the Iranian economy. In addition to the macroeconomic indicators (growth, inflation and unemployment), which have displayed an undesirable course for the last three years, the socio-economic dimensions or problems created by the faltering economy seem to have created the possibility to shake social stability.
The withdrawal of the US from the JCPOA, the direct and indirect effects of the pandemic, and Iran’s unique structural problems have had a severe effect on Iran’s economy, both macroeconomic and socioeconomic dimensions. One dimension of these effects is reflected in the socioeconomic sphere. It is observed that the poverty has been deepening in Iran, in the past couple of years. For the first time, an official institution published a study on the poverty and income distribution in Iran. This study, based on the findings of the above-mentioned official report, aims to delineate the general framework of the recent developments regarding the poverty problems and income distribution in Iran.
Iran Ministry of Cooperatives, Labour and Social Welfare released a “Poverty Monitoring Report” based on the “Household Income and Expenditure Survey, the year 1399 (2019-2020)” recently published by the Statistical Center of Iran. According to the report, the number of the middle-income households has been significantly decreasing. In parallel with this deterioration, it has been observed that a crucial part of the middle-income households slipped below the “poverty line”.
What is the Poverty Line?
The poverty line (threshold) specifies the minimum income required to meet basic needs such as food, clothing, shelter (rent), electricity, water, fuel, transportation, education, health, and so forth. In general, the term household is used to refer to family, consists of 4 people, and the minimum income required for this 4-person family to meet their basic needs has been identified as the “poverty line”. Although there have been various criteria for determining the basic goods and services, and their quantities, various institutions in several countries calculate poverty line.
In 1398 (2018-2019), the monthly poverty threshold for a three-person family was 2.000.000 toman; while it was 2.450.000 toman for a four-person family in Iran. As can be seen in the Table 1, the monthly poverty threshold increased by 38 percent in 1399, compared to the year 1398. With this increase, the monthly poverty threshold for a three-person family has been 2.760.000 toman and 3.390.000 toman for a four-person family.
Table 1: Poverty Line for Households in 1398-1399 (Toman)
| 1398 | 1399 | Growth Rate | |
| A Family of 3 | 2.000.000 | 2.760.000 | %38 |
| A Family of 4 | 2.450.000 | 3.390.000 | %38 |
Source: The Collection of Poverty Monitoring Reports
According to the report prepared by the Iran Ministry of Cooperatives, Labour and Social Welfare, while there was 26 million Iranians living below the poverty line in 1398, this number increased by 4 million in 1399 and thus nearly 30 million Iranians have to make end meets with an income below the poverty line. Respectively, Iran’s population is 81,8 million and 82,9 million in these years. Therefore, 31.8 percent of Iranians were living below the poverty line in 1398, whereas it increased to 36.1 percent in 1399 (see Table 2).
Table 2: People Who Live Below the Poverty Line
| 1398 | 1399 | Growth Rate | |
| Number of Poor People | 26.000.000 | 30.000.000 | %15,3 |
| The Ratio of Poor People to the Total Population | %31,8 | %36,1 | %13,5 |
| Iranian Population1 | 81.800.000 | 82.900.000 | %1,34 |
Source: Prepared by the author using the data of The Collection of Poverty Monitoring Reports.
1 The data concerning the population is obtained from the World Bank. The population of 1398 is presented with reference to 2018, and the population of 1399 is presented with reference to 2019.
In 1399, while the top 10 percent of the householders received 31.4 percent of the total gross national income, the bottom 10 percent of the householders received about 2 percent, in Iran.
Another important indicator related to the income inequality is “income-gap ratio”. This indicator is calculated as the ratio of total income received by the top 10 percent of the householders living in the urban (rural) locations to that received by the bottom 10 percent of the householders. In a given period, the greater the gap between the income received by top 10 percent and received by bottom 10 percent, in average, the worse the income distribution in this country.
While the income-gap ratio for the urban households was 6,67 in 1395; it decreased to 6,48 in 1399 (see Table 3). According to the Table 3, the income-gap ratio for the rural households was 7,16 in 1395 and it worsened in 1399 to 7,67. While the strictly imposed lockdown measures paved the way for closing the gap in urban locations, the rural locations had a reverse situation. It is believed that the income loses (unemployment benefits etc.) due to covid have affected the urban households, and also the rural employment has mostly hidden, and informal characteristics have prevented from receiving such aids.
Table 3: Income Scissors
| 1395 | 1399 | |
| City | 6,67 | 6,48 |
| Rural | 7,16 | 7,67 |
Source: The Collection of Poverty Monitoring Reports
Another important indicator used to measure the change in the income distribution is the difference between the consumption expenditure of rural and urban households. There are various calculation methods used for measuring this difference. Among the most common tools, “the consumption-gap” is calculated as the ratio of the average consumption expenditures made by the top 10 percent of the householders to that made by the bottom 10 percent of the householders.
According to the report, the consumption-gap between or the ratio of the average consumption expenditures made by the top 10 percent of the urban householders to that made by the bottom 10 percent of the urban householders is 12,2 in Iran. In other words, the average consumption expenditures made by the top 10 percent is 12,2 times greater than the average consumption expenditures made by the bottom 10 percent. The same ratio for rural householders is 18. In this context, the consumption gap statistics show that there is a more serious inequity in rural areas.
Although the well-known Iranian economist Djavad Salehi-Isfahani believed that the report prepared by the Iran Ministry of Cooperatives, Labour and Social Welfare is valuable, he claims that the figures do not reflect the facts, or the report devalues the income distribution and poverty problem. According to Isfahani's own calculation, in comparison with the pre-sanctions period, in Iran, there has been a noticeable decrease in the consumption expenditures of all income groups in 2020. During this period (2017-2020) the real household expenditures decreased by 18 percent, and this has been observed in all income groups.
As a result, the economic and political turbulence that started after the US withdrawal from the JCPOA has increased even more as a result of the direct and indirect effects of the epidemic on the economy. In Iran, income distribution and the rate of poverty have noticeably worsened in the last three years, especially in the rural areas in Iran.
